


What’s an Order of Magnitude Between Friends?
Time to discuss an insidious and systemic problem through the lens of two case studies. Along the way, we’ll learn & discuss the necessary math to see whence this problem comes and where the errors lie. It bears note that these examples are extraordinarily common use cases of conditional probabilities in western medicine, occurring across the world every day. Indeed, at the center of the justifications for Covid-19 lockdowns, and many other government human rights and personal sovereignty violations that we just lived through, was the willful misuse of medical testing diagnostics and statistical inferences from those tools.1
A. An Epidemic of Diagnostics
If you go to the Harvard Health website, here, you can read this:
From biopsies to bypass surgery, you'll find information below on more than 110 tests and procedures. Designed to remove anxiety and uncertainty, these concise reports explain the purpose, how to prep, how it’s done, the risks, follow-up, and helpful outside links.
(my emphasis on uncertainty).
Harvard Health’s website by no means covers all of the possible medical diagnostics available; these are just the ones inexpensive enough that the medical authorities have deemed usable on the rubes. On the page are more than a hundred common diagnostics, tests, and procedures that (one can’t help but notice) are going to “remove anxiety” that comes from “uncertainty.” Not coincidentally, the California Psychics website - indeed, its very tagline - promises its clients the very same thing as Harvard Health’s diagnostics website, except in reverse image: California Psychics will “remove [your] anxiety” by replacing it with “the Joy of Certainty.” (Go ahead and laugh it up for the moment at the silly psychics).
In 1978, Casscells et al published a small but important study2 showing that the majority of physicians, house officers, and students overestimated the positive predictive value (PPV) of a laboratory test result using prevalence and false positive rate.
“Medicine’s Uncomfortable Relationship with Math: Calculating Positive Predictive Value,” Manrai, A. et al, JAMA Intern Med. 2014 June; 174(6): 991–993.
Let’s not skip the details because some of you can only be convinced by brute force. How much did they overestimate PPV by… a little? In 1978, Dr. Casscells had a hypothesis - that doctors didn’t understand the math necessary to give accurate advice about the results of medical diagnostics tests - so he and a few colleagues asked 20 physicians, 20 residents, and 20 medical students at Harvard teaching hospitals the following question:
If a test to detect a disease whose prevalence is 1/1000 has a false positive rate of 5%, what is the chance that a person found to have a positive result actually has the disease, assuming that you know nothing about the person’s symptoms or signs?
This is a math problem with a very definite, single, correct answer that can be derived using the eponymous theorem of our old friend Thomas Bayes. We’ll do the math below, but the important part isn’t the number itself: the important point is that out of 60 doctors, residents, and med students at Haahhvahd teaching hospitals only 11/60 (18%) got the correct answer. B-b-but this is just a… uh…. a statistical anomaly… Harvard has only the Toppest of Toppe Medical Men and WoMen!
In July 2013, the same question was asked of a convenience sample of physicians, residents, and medical students (n = 61) at a Boston area hospital with 23% answering correctly.
“The Inability to Calculate Predictive Values: an Old Problem that Has Not Gone Away,” Stovitz, S., Medical Science Educator (2020) 30:685–688.
For those who like odds, this means that if you get a medical test in a Boston hospital, you’ve got slightly less than a 1 in 4 chance that your doctor can interpret the results correctly. And just so it doesn’t seem like I’m picking on the profession, let me pile on with the details. (Don’t worry, it only gets worse as you delve deeper). In his 2020 paper, Dr. Steven Stovitz reviews some of the prior literature, dating back to the 1960s, which strongly suggests that the majority of the medical profession has no idea about the mathematics necessary to calculate the positive predictive value of the medical tests and diagnostics that they’re using.
The problems isn’t simply that only 11/60 or 14/61 got the correct answer, it’s that the other 49 or 44 docs were wildly wrong about what the test actually meant for the patient’s health by at least an order of magnitude. To be precise, the correct answer is a positive predictive value (PPV) of 1.96% - which is to say that the patient in the hypothetical problem had just less than a 2% chance of “having” whatever condition the test was designed to discover… but in the 1978 Casscells study, 27/60 (45%) of the doctors and residents said the PPV was “95%.”
Let’s just sit with this for a minute: 11/60 docs said correctly that the test results meant the patient had a 2% “chance” or “likelihood” (but for those of us in the know, it’s “probability”) of having the disease being tested; 27 of the remaining 49 would have told the patient that they’re probability of having the disease was 95% - that’s 48 times more likely than the reality. In the 2013 rerun of the study (with N=61), the Manrai study got… the same number, 27, who said that the PPV was 95%.
B-b-but it’s different if you ask doctors about tests in their particular spesh-ee-al-i-tee!
In a 2007 medical education seminar, Prof. Gird Gigerenzer of the Max Planck Institute was teaching 160 gynecologists. He gave them a similar question to calculate PPV for a hypothetical patient’s mammogram results. He gave the disease prevalence for breast cancer in women (1%), the sensitivity of the test (90%), and a 9% false positive rate and then asked: if a woman tests positive, what are the chances that she actually has the disease? He then provided 4 possible answers A-D in multiple choice format. The correct answer was C (“out of every 10 women who test positive, about 1 has breast cancer.”) 34 out of 160 (a paltry 21%) got the correct answer, less than what “random guessing” would produce (about 1 in 4, right, frequentists?)

B. Math Alert for Those Who Couldn’t Pass O-Chem.

We previously looked at Bayes’ Theorem just briefly while discussing conditional probability and now we’re going to use it in some “real world” examples (i.e. the hypotheticals above). Before we do, we’ll have some warm-up lessons on conditional probability that will get us where we need to be.
Let’s suppose that we have an awesome medical diagnostic Test (T) that tests for horrible deadly Disease (D). We’ll start with a simple 2 x 2 matrix to see what the possibilities are. (This isn’t meant to be pedantic, but to help see what’s going on in medical diagnostics for later).
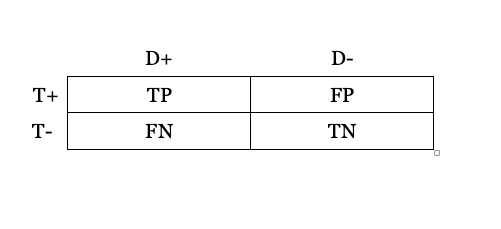
Across the top is your disease status: if you Test positive (the T+ row), you either have the disease (D+), which means you have a True Positive (TP) test result, or you do not have the disease (D-), which means you have a False Positive (FP) test. You could also have the disease (D+), but have a negative test (T-), a False Negative (FN), or you could test negative and that could be correct, so you have a True Negative result (TN).
Some important relations to understand about rows/columns: The total number of people who have the Disease (D+) is the sum of all of the True Positives (TP) with a correct test result - which is an ironic name - plus all of those happy souls who have no idea that they’re disease-stricken from a False Negative result (FN).
We use the term sensitivity to refer to the Test’s success rate: that is the True Positives (TP) divided by all of those with the Disease (D+ = TP + FN). Therefore, Sensitivity = TP/TP + FN.
Likewise, all of the healthy people who are disease negative (D-) are the sum of the poor bastards who have been incorrectly told that they are disease-stricken by false positive tests (FP), plus all of the fortunate souls who have had their lack of diseased-ness confirmed by a correct test result - True Negatives (TN). The True Negatives (TN) divided by all Negatives (TN + FN) is also called the Negative Predictive Value.
The Positive Predictive Value (PPV) of a test is simply the total number of true positives (TP) divided by all positives, which is to say the total of both the true and the false positives. PPV = TP/ TP + FP.
Further Considerations: In order to know if our Test (T) is correct, we would have to have some independent way of objectively verifying the Disease (D) separate from our test (a “gold-standard”). For example, we could pretend that within 72 hours of getting our hypothetical disease, every single person who gets it breaks out in bright purple spots, thus confirming or disconfirming the disease. For our purposes, that’s been done with diagnostic tests already. One final, significant, essential item to know is the disease’s prevalence in the population that you’re testing. Why is that, you might ask? Well… in short, because it matters A LOT.3
John Venn has Entered the Chat: …as it turns out, Venn diagrams are very helpful in illustrating conditional probabilities, especially when it comes to medical testing of populations. So, let’s have a quick refresher on Mr. Venn and then back our way into Bayes Theorem.
Consider two events, A and B, in some sample space S per the image below. The sample space S is a rectangle and two events, A and B, are drawn within as circles. The possible ways in which the events can overlap are: (left) there is some intersection between A and B, (middle) there is no intersection, and (right) there is complete overlap of A and B. In words, in the first image, some cases of B cause some cases of A to occur - there is some intersection (“∩”) between them. (i.e. Mathematically speaking, there is a set of something that corresponds to A ∩ B). In the middle image, there is no case of B causing A to occur at all (no intersection), and in the final one, every B results in A (plus A also has other cause outside of B, as well).

The probability of an event A occurring, given some other event B has already occurred, is written in symbolic logic/math as: P (A | B) and by definition that is equal to P (A ∩ B)/P(B).
Visually, it looks like the below picture:

The probability of A occurring given B is that small yellow-hased area divided by the whole of the probability of B. This is just Laplace’s definition and basic statistics made visual: the probability of an event occurring (dice rolls or coin flips or card draws) is the number of successful outcomes over the total number of possible outcomes.
PLEASE also keep in mind what this diagram suggests visually: A and B are two equally sized circles with some relatively small intersection (∩), hashed in yellow, inside of this larger white rectangle. In reality, in addition to what we noted above about the three possible intersection or non-intersection cases, we’re also not quite sure what A looks like in terms of its relative “size” (i.e. probability) as compared to B, nor as a portion of the rectangle. A and B might both be miniscule, tiny little circles, or B might be much smaller, etc.
For now, however, we use the simplest example visually to stand for a case where there is some P (A ∩ B) in yellow.
Similarly, the probability of B given A, written as P (B | A) = P (B ∩ A)/P(A), looks like this:
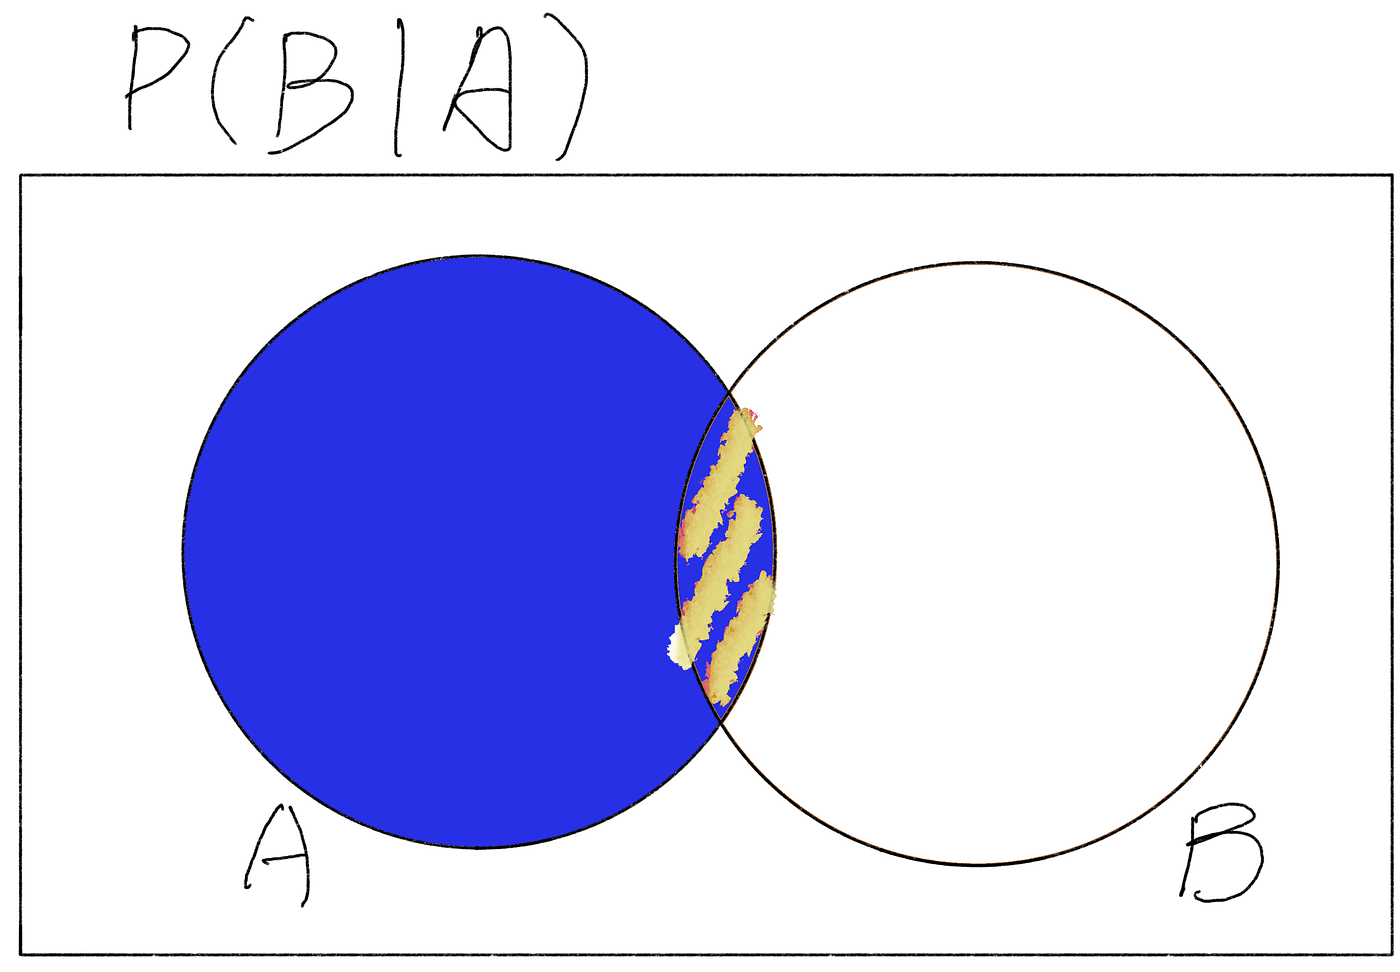
What’s important to say about this is that the P (B ∩ A) is identical to P (A ∩ B) from above. In other words, for the same probability space S, as long as we’re talking about the same A and B, then P (B ∩ A) = P (A ∩ B).
That little piece of information allows us to manipulate our conditional probability equations to solve each for its respective “yellow-hashed” piece of the equation:
P (A | B) = P (A ∩ B )/P(B), when algebraically manipulated by multiplying both sides of the equation by P(B), can then rewritten as
P (A ∩ B) = P (A | B) * P(B)
This same manipulation can be done for B, such that
P (B ∩ A) = P (B | A) * P(A).
As noted above in the diagrams, P (A ∩ B) and P (B ∩ A) are the same, so we can set our equations equal, churn the math, and guess what it turns out to be?
Boom. You’ve derived Bayes Theorem. As noted previously:
={\frac {P(B\vert A)P(A)}{P(B)}}}")
Verbally: the probability of A given B is equal to the product of the probability of B given A and the probability of A, divided by the probability of B. Okay, wonderful, you’re thinking, now what?
C. Now Let’s See Who the Doctor Is.
Let us return to where we started, but instead of simply talking about how awful the medical profession was with conditional probabilities, it’s time for you to play Doctor, Doctor! Suppose that instead of using As and Bs in Bayes Theorem, we start talking about Ds and Ts, as in:
What is the probability that I have a Disease (D+) given that I get a positive Test (T+) result for “a disease whose prevalence is 1/1000 [the test] has a false positive rate of 5%?” (This is the original example in Casscells study).
What we can (perhaps) grasp now is that the prevalence of the disease in the population and the true positive and false positive rates of the test tell us (in Venn diagram terms) the relative shapes and sizes of A and B and their intersection within S. What these parameters tell us in mathematical terms is most of what’s missing from Bayes’ Theorem, and allow us to derive the correct answer to the question we really want to know: what is the probability someone actually has the disease if they test positive for it?
We can rewrite and redefine our As and Bs for our example and use our formula:
P (D+ | T+) = [P (T+ | D+) * P(D+)] / P(T+)
The Probability of a Positive Test given you have the Disease, P (T+ | D+), we will assume the test is pristine in this regard and it correctly captures everyone who has it. Thus, P (T+ | D+ ) = 1. The probability of having the disease, P (D+) is 1 in 1000 (prevalence). The only unknown remaining in this equation is P (T+), the probability of a positive Test (T+), which can be derived from what we already know. We know (from our grid above) that T+ is the sum of all the True Positives (TP) and False Positives (FP). (T+ = TP + FP). We can determine these probabilities by using the disease prevalence, the test sensitivity, and the test’s False Positive Rate (FPR).
The probability that someone gets a correct T+, P (TP) is simply the disease prevalence 1/1000 (or .001) times 95% TPR (.95, the test sensitivity). We then add the False Positives, which is the number of the 999 who don’t have it but still get a False Positive ( an incorrect T+), which is 999 multiplied by the FP rate of 5%. (999 * .05) = 49.95 false positives.
Now, let’s just think for a second.
You’re being tested for a disease that is relatively rare - only 1 person in 1000 gets it. The test itself is pretty good, wth a 5% false positive. That means that in every thousand people, only 1 person will have the disease and we assume that if he takes the test that it will correctly return a positive (T+). Of the remaining 999 healthy people (D-), however, roughly 50/1000 will get a test result that says they’re T+ when they’re NOT. (Quelle horreur!) You’re sitting there with a T+… are you the 1 correct positive or the 50 incorrect?
Well, the probability, or likelihood, or “odds” or “chance” if you want to use those latter terms, that you have the disease is roughly 1 in 51, or just shy of 2% (1.96%). In every thousand people tested, 1 is correct and 50 are wrong. You are far more likely to be one of the 50 than the single person in 1000 who has the disease - almost exactly 50 times more likely in fact.
Now, to close this out, realize that in the examples given at the very beginning, Harvard doctors would incorrectly tell a patient that there was a 95% chance they had this rare (possibly deadly?) disease. And consider that that there are 50 more false positives because of the low prevalence of the disease who have a 3 in 4 chance of being told the same incorrect probability. That’s a carnage of unnecessary and possibly life-changing anxiety for 50 people who don’t even have the condition…
Now multiply that across all of the tests shown on that Harvard website.
That’s your modern medicine as it stands right now.
It is also worth noting that it is much easier for authority to manipulate an innumerate population than a numerate one.
“Interpretation by physicians of clinical laboratory results,” N Engl J Med. 1978; 299(18):999–1001. [PubMed: 692627]
Not taking into account the disease prevalence is what is known as the base rate fallacy.
Love it, as always.
My only caution is against writing probabilities "P(T)" or the like. It's not wrong, but it causes many to forget that there is no such thing as unconditional probability. I.e. all are like Pe(T|E) where the evidence E is made obvious.
(I'm way behind on everything. Haven't even got to your other yet.)
It is worthwhile to note that with your 1/1000 prevalence and 5% false positive rate, if you test a population of 1000 you could(mathematically) get either 50 positives or 51. That is, there are 50 tests that will read positive whether the person has the condition or not and the person who has the condition might(1/20 chance) get one of those 50 tests.
Of course, pointing this out will make your rather elegant post a bit more complicated and less clear and certainly doing that math will lose some of your audience unnecessarily.